

This study attempted to experimentally investigate the effect on response rate of three factors: questionnaire length, follow-up procedures and geographical differences. A fixed-effects 64 cell experimental design was created which investigated the impact of a six page versus a four page questionnaire; four different follow-up methods (post card reminder, telephone reminder, telephone interview with alert and telephone interview without alert); and eight heterogeneous geographical areas of the country selected based on a cluster analysis. The results showed no differential effects of questionnaire length on response rate. However, follow-up methods produced significantly different results and the rate of response was significantly different among the geographical regions.
While considerable experimental research exists on the rate of response in mail surveys as a function of a variety of manipulations, there is still very little agreement on the factors that are conducive to optimizing the rate of response (Champion and Sear, 1969; Erdos 1970; Gullahorn and Gullahorn 1963; Landy and Bates, 1973; Linsky 1965; Scott 1961). Our study is one more experimental effort to measure the main and the interaction effects of (a) questionnaire length, (b) follow- up procedures, and (c) geographical differences on the rate of return of questionnaires mailed to a large random sample of telephone customers. The study consisted of a 2x4x8 three factorial fixed effects field experiment study involving a total of 64 cells experimental design; and a follow-up interview with a subset of the sample to explore respondent attitudes toward mail surveys.
Experimental Design
The first experimental factor, questionnaire length, consisted of two levels: a four-page short questionnaire consisting of 23 items related to the socioeconomic-demographic profile of the respondent, and a six-page long questionnaire consisting of the sane 23 items plus an addition of 26 additional items measuring respondent attitudes toward the telephone as a product and a service.
The second factor was follow-up methods. Four follow-up methods were selected based on cost and feasibility considerations. Following the mailing of a post card alert and the questionnaire, the four follow-up methods utilized were as follows:
- Post card reminder and a second mailing of the questionnaire
- Telephone reminder and a second mailing of the questionnaire
- Letter alert followed by a telephone interview
- Telephone interview without alert
The third factor, geographical heterogeneity, consisted of eight distinct geographical regions of the country. The geographical areas were chosen based on a cluster analysis of one hundred geographical areas which represent the total population for the Bell System telephone customers. Each geographical cluster consisted of homogeneous customers with respect to their socioeconomic-demographic profile and their telephone behavior profile. The following eight geographical areas were chosen to represent each of the eight clusters: Southeast Massachusetts, San Jose, Arizona, Philadelphia, Eastern Wisconsin, Suburban Chicago, Fort Worth and Alabama.
Method
Within each of the eight markets, a representative random probability sample of 264 customers was drawn and equally divided among the eight experimental conditions created by the two questionnaire lengths and the four follow-up procedures. Thus, each experimental cell had a sample of 33 customers. The only exception was with respect to the eight experimental groups in the Southeast Massachusetts region where a sample of 296 customers was drawn and equally divided into the eight experimental conditions to compensate for the anticipated higher rate of disconnection of telephone services due to the end of the summer season.
The experiment began with the mailing of an alert post card to the total sample of 2144 respondents (264×7+296) on a Monday of the first week of the experiment followed by the mailing of the questionnaire on the following Wednesday. The post card and telephone reminders were initiated on Friday of the second week if the questionnaire had not been received by that time. The mailing dates including those for the follow-up procedures were designed in such a way as to compensate for the regional variations in postal delays. A total of four attempts were made to contact each respondent for the telephone reminder and the telephone interview procedures. Finally, calls were made at various times of the day and evening which the local supervisor considered most appropriate in terms of receiving cooperation. In short, every possible effort was made to minimize the differences in situational factors (time, person and opportunity to reach) in the field experiment setting between the telephone and the mail interviews.
Data Analysis Results
As stated before, the total sample was equally divided into the 64 cells giving a cell-sample of 33 customers each except in the Southeast Massachusetts area. The questionnaires returned from the post office as undeliverable were subtracted from the sample base in each of the cells. Further, the additional mailings made in the Southeast Massachusetts were taken into account to modify the base for each experimental cell so that the number of returned questionnaires for each cell would be comparable.
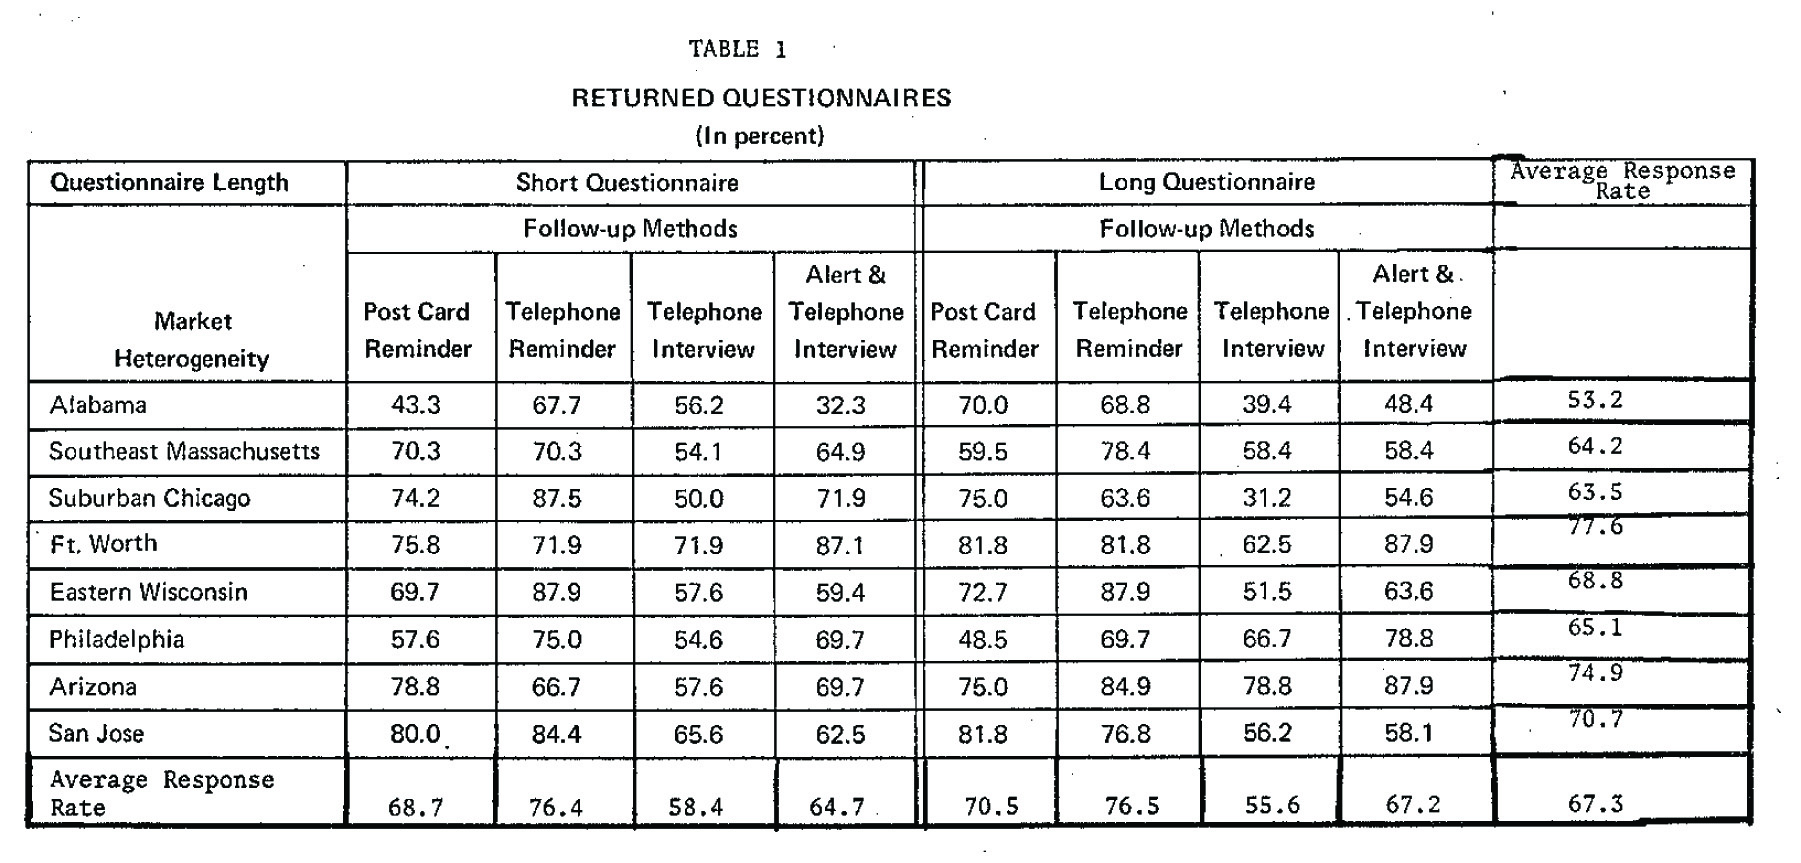
The experimental results are summarized in Table 1. The range of the rate of response varies from a low of 32.3 percent in one cell to a high of 87.9 percent in another cell.
In most experiments, the dependent variable is metric which enables the research to calculate the within-cell variance from which the experimental error can be estimated. However, our experiment includes a binary dependent variable (response or no response) resulting in a single observation (number or percent of responses) within each cell. Thus, direct estimation of the experimental error is not possible. Fortunately, Tukey (1949) has suggested two possible models for single observation cell designs both of which are still a part of the general linear additive model. The models are:

In the first model, there is presumed to be no joint effects of all the three factors; only the main and the pairwise interactions are assumed to exist in the data. In this model, all sources of variation other than the main and the pairwise interactions are treated as due to the experimental error. The second model, however, presumes that joint effects of all experimental factors are real and causal. It is called the nonadditive model. Tukey (1949) has provided a test for the existence of nonadditivity condition (Winer 1971, pp. 394-397). When the null hypothesis could not be rejected, one can utilize the first additive model which then enables the researcher to estimate the experimental error as all variations not accounted for by the main effects and pairwise effects in the experiment. In our analysis, the calculations showed that the null hypothesis could not be rejected (F – 0.11 with 1 and 20 df) as shown in Table 2. The analysis of variance calculations based on the first model in which joint effects of all the three factors are considered an estimate of the experimental error are also summarized in Table 2. From it, we can conclude as follows:
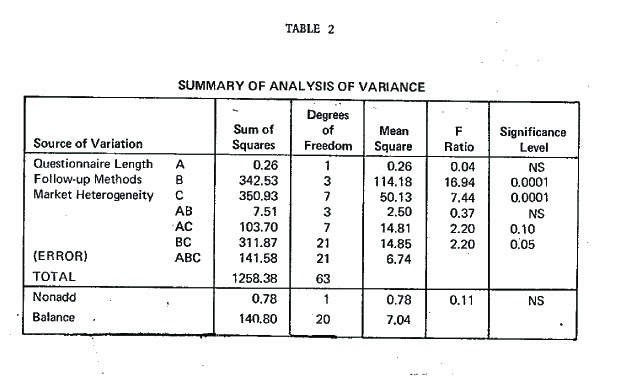
- The questionnaire length has no significant effect on the rate of return. The longer questionnaire apparently did not act as a deterrent in maintaining the rate of response. In fact, there is a slightly better rate of return with the longer questionnaire than with the shorter questionnaire.
- The follow-up methods have a significant effect on the rate of response. In other words, telephone reminder worked best and telephone interview without alert worked best.
- The geographical differences are significantly responsible for the differential rate of response. The best response came from the Fort Worth area and the worst response from the Alabama area.
- There is no interaction effect between the questionnaire length and the follow-up methods. Thus, the significant effects of follow-up methods are independent of the questionnaire length.
- The questionnaire length, however, is marginally related with geographical differences. Certain geographical areas tend to respond better with shorter questionnaires and others with longer questionnaires.
- There is a significant interaction effect between the follow-up methods and geographical differences. Some follow-up procedures work better in only some geographical areas and others work better elsewhere. This clearly suggests some strategy of market segmentation in terms of the utilization of follow-up methods.
In order to localize the source of experimental variance attributed to the two significant factors (follow-up methods and geographical differences), the Newman-Keuls test was performed on the ranges of pairwise within-factor differences (Winer 1971, pp. 191-196). The results clearly indicated that most of the within-factor variance arose due to the two follow-up procedures of the telephone interview without alert and the telephone reminder: the former was significantly worse (p .01) than the other three follow-up methods and the latter was significantly better than the post card reminder (p<.05) and considerably better than the telephone interview with alert as well as without alert (p .01).
In regard to the geographical differences factor, Alabama was significantly poorer (p<.05) in generating high response compared to all the other seven regions. Similarly, Fort Worth was significantly superior in generating better response rate than the four markets of Alabama, Suburban Chicago, Southeast Massachusetts, and Philadelphia (p<.05). In fact, nearly three-fourths of the variance attributed to the geographical differences factors was localized in the extreme response rates in Alabama and Fort Worth; the other six regions tended to be fairly homogeneous in response rate.
The implications from the above experimental results are somewhat obvious. Since the length of the questionnaire had no adverse effect at least within the range tested in the experiment, we should not be overly concerned about its impact on the rate of response. This has been a consistent finding across many other studies (Scott 1961). Second, telephone reminder works best and at the same time, it is quick, efficient and easy to control. Since there are no real cost differences between post reminder and telephone reminder, the added advantages of personalizing the reminder on the phone is a clear plus in favor of telephone reminder. Third, the study clearly suggested that not all geographical areas of the U.S. respond the same way. It is, therefore, necessary to oversample in poor responding areas in order to compensate for a smaller rate of return. Perhaps the most significant implication of this experimental study lies in the interaction effects between the follow-up methods and geographical differences. According to the experimental results, a single procedure does not necessarily generate better results across geographical regions. Thus, it is best to segment the areas and utilize differential follow-up procedures best suited for each geographical segment. From the results summarized in Table 1, it is obvious that while telephone reminders were the best follow-up method in terms of overall impact, post card reminder was better in the Suburban Chicago area and telephone interview with alert was better in Fort Worth area. Accordingly, it may be advantageous to customize follow-up procedures for each type of geographical area to the extent that the cost of differential methods does not become prohibitive. It is surprising how little emphasis has been placed on the strategy of segmentation in survey research work.
References
CHAMPION, D. & SEAR, A. Questionnaire response rate: A Methodological Analysis. Social Forces, 1969, 47, 335-339
ERDOS, P. L. Professional Mail Surveys, New York: McGraw-Hill, 1970
GULLAHORN, J. GULLAHORN, J. An investigation of the effects of three factors on response to mail questionnaires. Public Opinion Quarterly, 1963,27 294-296
LANDY, F. I. & BATES, F. The Noneffect of three variables on mail survey response rate. Journal of Applied Psychology, 1973, 58, 147-148
LINSY, A. A factorial experiment in inducing responses to a mail questionnaire. Sociology and Social Research, 1961, 124, 183-189
SCOTT, C. Research on mail surveys. Journal of the Royal Statistical Society, 1961, 124, 143-205
TUKEY, J. W. One degree of freedom for nonadditivity. Biometrics, 1949, 5, 232—242
WINER, B. J. Statistical Principles in Experimental Design, Second edition New York: McGraw-Hill, 1971