

Introduction
Recently, Litvak and Banting(2) have developed a useful conceptual framework for international business arrangements based on empirical data collected from a large number of manufacturers, their agents and other middlemen in the United States, Canada and South Africa. A major aspect in their conceptual framework is the three—fold classification (hot—moderate—cold) of countries with the use of the country’s following environmental factors: (1) political stability, (2) market opportunity,(3) economic development and performance, (4) cultural unity, (5) legal barriers, (6) physiographic barriers, and (7) geo-cultural distance from the U.S. A “hot—cold” gradient or index is then suggested in which the first four factors are considered hot factors and the last three factors are cold factors.
Depending upon the intensity of each of the seven factors (high— medium—low), Litvak and Banting suggest classification of a country as a hot, moderate or cold country for foreign investment. If a country is found to be hot, it is considered most profitable for a U.S. multinational corporation to heavily invest its financial and managerial resources. On the other hand, if a country is found to be a cold country, it is advisable to leave the financial and managerial investment to the company’s local agent. Litvak and Banting describe the suitability of a number of business arrangements ranging from simply exporting to establishing wholly—owned subsidiaries in a foreign country based on the three—fold classification.
This conceptual framework seems to offer several advantages from the point of view of long range planning and expansion decisions of a multinational company. First, it presents, though somewhat crudely, a method of allocating scarce resources selectively to some countries and some parts of the world. Second, it specifies both the magnitude and the type of foreign investment involvement depending upon the hotness or coolness of a country. Accordingly, it gives insights into the relevance of a variety of foreign investments ranging from joint ventures, through franchised operations, to manufacturing and marketing the company’s products. Third, the conceptual framework neatly summarizes the evolutionary process of emergence of a multinational corporation from a simple export house. Finally, and perhaps equally important, the conceptual framework suggests how a large body of secondary data on environmental factors can be effectively utilized to undertake long range planning and business expansion.
Although the Litvak—Banting framework is conceptually useful and exciting, it sufferers from a number of methodological and analytical problems. First, no analytical scheme is developed which will transform the values of the environmental factor into the gradient of hotness. Second although the environmental factors are explicitly described, no attempt is made to suggest their operational indicators. Third, the three-fold classification of countries is at best judgment and arbitrary, rather than empirically derived. Fourth, there is no discussion about the relative importances of various environmental factors: Is poetical stability more important than economic development and performance? Finally, it would seem that the environmental factor called market opportunity is considerably different from other six factors: it is specific to an industry or product, while other factors are invariant to the type of foreign investment. Furthermore, it is generally necessary that primary data be collected to estimate the m2rket opportunity of a product or industry, whereas one can get by with secondary data for the other six factors. Accordingly it might be best to at first classify countries on the six factors and then to investigate the market potential in those countries which promise to be serious candidates for foreign investment.
The purpose of this paper is to operationalize the Litvk—Banting framework with the use of a secondary data bank. In the process, it is hoped that some insights will be presented to remove, or at least minimize, the methodological problems enumerated above. Finally, a multivariate model is attempted in the paper which suggests one analytical approach to the development of the “hot—cold” gradient on which countries can then be graded from the point of view of future investment and business expansion.
Sources of Secondary Data and Operational Definitions
The secondary data related to the six environmental factors were obtained from three separate sources: (1) The Yale Political Data Program, (2) The Dimensionality of Nations Study, and (3) The Bank—Textor Cross— Polity Survey. These data are a part of the data archives stored at Survey Research Laboratory, University of Illinois. All the three data sources are related to 1961—62, and represents profiles of a total of 82 countries. However, the USSR and Communist China were not included in the final analysis due to their large ideological differences with the U. S. Accordingly, a total of 80 countries were included in the development of the ‘hot—cold” gradient from the point of view of U.S. corporate foreign investment.
From the complete profile on each country, a total of 26 variables were found to be related to the six environmental factors. However, due to missing data on a number of these variables, a final list of 15 variables was prepared. The list is reproduced in Table 1 along with the brief description of each environmental factor as given by Litvak and Banting.
Political stability is indicated by the following three indices: (1) governmental stability, (2) freedom from group opposition, and (3) political enculturation. The latter reflects the political consciousness of a country.
Cultural unity is represented by three different indices of homogeneity. They are (1) religious, (2) racial, and (3) 1ingustic homogeneity, each being a three point scale.
Economic development and performance is reflected by two variables:
(1) an economic development scale (a 4-point scale), and (2) energy consumption in megawatt hours.
Legal barriers is indicated by two indirect variables. The first is the level of imports and exports measured in millions of U.S. dollars. It is argued that a greater degree of international trade will be present in a country characterized by fewer legal barriers and vice versa. Similarly, the second variable is the amount of tariffs on imports as a percentage of the total value of imports. Again, the greater the number of legal barriers, the more likely it is to find a higher levy o tariffs, and vice versa.
Physiographic barriers is also only indirectly indicated by the three modes of transportation. It is assumed that the greater the physiographic barriers present in a country due to mountains, deserts and rivers, the less will be the density of air, road and railroad transports. By simultaneously taking into account all the three major surface and aerial methods of transportation, we presume that substitution effects among them, if any, are included.
Finally, geo-cultural distance is measured in two ways, both of which are relevant primarily to obtain distance of a country from the U.S. The first measure is an index of westernization, a six-point scale. The second is the air distance from the U.S.
The Multivariate Model
Multivariate Model methods are becoming more common in international business. Perhaps the single most common method has been cluster analysis to classify countries on a profile of economic are demographic characteristics. Our objective here is to drive an index or gradient on which countries can be located. As such, the objective is somewhat different from strict classification. A specialized multivariate method, therefore, is proposed in this paper to achieve this objective. We may also note that the procedure resembles factor analysis, but it differs from it at various stages of the calculations.
Let XNxn be a data matrix with Xij elements, (i = 1, 2, 3, . . .N, j = 1, 2, 3, . . .n) where Xij refers to the ith country’s value on variable j. Each row of the data matrix represents the profile of a country, and each column represents the distribution of values of a given variable.
If X is a rectangular matrix (N>n) and all the cells have values, it is possible to state X as a product of three other matrices following the basic structure theorem. Thus
x = urw
Where U and W are orthonormal matrices (U1 = U1 and W1 = W-1) containing vectors associated with the data matrix and r is a diagonal matrix containing roots associated with the data matrix.
By selecting only some of the vectors and roots from the u,r, and W matrices (generally equal to the rank of the data matrix X), it is possible to construct an approximate data matrix, X^ , which is the best approximation in the least squares sense. Thus
X ~ X^Nxn = UNxr rrxr Wrxn
It is now possible to state that UNxr represents projections of the rows (countries) on some r-dimensional space (r<n<N) and Wrxn represents simultaneous projections of the columns (variables) on the same r-dimensional space.
Each of the r-dimensions, after proper rotation, can be looked upon as a “hot—cold” gradient from the viewpoint of that country which is most closely associated with that dimension. The closeness of association of a country with a dimension is represented by the size of the projected value of that country. It is then easy to read off relative values of all other countries in terms of their degree of hotness or coolness on that dimension by examining the elements of the rth vector.
In order to obtain the basic structure of a data matrix, Sheth (4) has suggested the use of Eckart—Young theorem stated below:
x = urw
XX1= (urw) (w1u1)
= ur2ul
because W1 = W-1 and therefore WW1 = I. In other words, by obtaining the cross—products matrix of a data matrix, it is possible to derive two of the three matrices on the right hand side of the equation. It is relatively easy then to obtain the W matrix:
W = r-1U-1X
Once the three product matrices are derived, it is equally easy to choose the first r roots and associated vectors to form the approximate matrix X^
The above multivariate method underlies factor analysis because a factor loadings matrix is defined as the Ur = A matrix and a factor scores matrix is defined as the U F matrix. Thus
X = AF.
However, there are a number of subtle and significant differences between the model and factor analysis:
(a) In factor analysis typically the interest is in the correlational structure among variables (R-type factor analysis), whereas in our model the interest is in the structure among countries (Q-type factor analysis).
(b) Typically, factor analysis is performed on a correlation matrix. In our model, we obtain the rank of the data matrix X through its cross—products matrix.
(c) The emphasis in factor analysis is the overall parsimony of the data matrix. In our model, parsimony is directly related to the specific viewpoints the researcher is interested in. Accordingly, the rotational procedures nay vary between the two methods.
Results and Discussion
From the three sources of secondary data, a data matrix XNxn was constructed consisting of 80 countries (N=80) and 15 variables (n = 15). The data matrix was converted from raw score to standard scores in order to remove the effects of varying types of units of measurement of variables. This is especially necessary in multicountry, data because the latter typically combine economic, social and demographic types of information. Consequently, income is measured in U.S. dollars whereas distance is measured in miles and population is measured in terms of density. In our data also the units of measurement are disparate in several instances: e.g. energy consumption, import plus exports, etc.
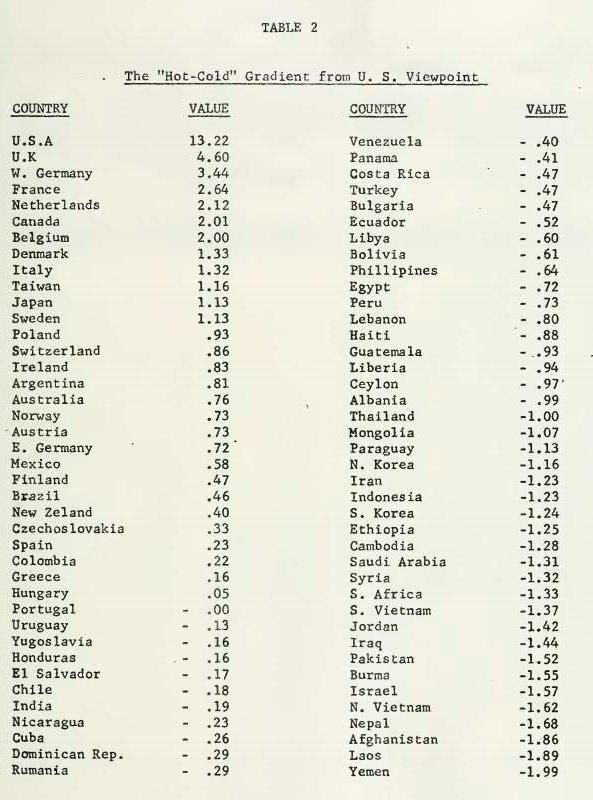
The standard scores matrix was then decomposed through the use of its cross—products matrix. Since this study is an attempt to operationalize the Litvak—Banting framework specifically in terms of U.S. corporate investment, our interest is in only one viewpoint —— the viewpoint represented by that dimension on which the U.S.A. is at closely associated. Table 2 reproduces that dimension. It represents a ‘hot—cold” continuum based on the six environmental factors. The relative positive values of countries reflect the degree of hotness and the relative negative values of countries reflect the degree of coldness from the viewpoint of U.S. corporate foreign investment in those countries.
A number of observations can be made on the results:
(a) Most other advanced countries have the highest “hotness” values. These include U.K., W. Germany, France, Netherlands, Canada and Belgium. Conversely, most developing and small countries have the highest “coldness” values. These include Yemen, Laos, Afghanistan, Nepal, N. Vietnam, etc.
(b) Although Canada and Mexico are closer in geographical proximity, numerous other countries are shown as better candidates for foreign investment.
(c) Portugal acts as the ‘true” neutral country from an investment viewpoint. It is neither hot not cold, as shown by its zero value. It should, however, be remembered that this neutrality is relative to other countries and not in any absolute sense.
(d) The East European and the other communist countries in Latin America, Africa and Asia do not systematically cluster together in the cold spectrum of the continuum. For example, Poland, E. Germany, Czechoslovakia and Hungary have positive values.
(e) It is somewhat surprising to find that even the most hot country (U.K.) is considerably separated on the continuum from the U.S. This implies that overseas investment in general is more problematic than domestic investment.
Conclusion
In summary, we have attempted in this paper to show how one multivariate method can be effectively utilized to transform the Litvak—Banting conceptual framework into an analytical model of overseas business expansion. It is also demonstrated that the secondary data, which are readily and cheaply accessible, can be meaningfully utilized if one at first derives a conceptual framework.

References
1. Liander, Bertil (ed.) Comparative Analysis for International Marketing (Allyn & Bacon, 1967).
2. Litvak, I. A. and P. M. Banting, “A Conceptual Framework for International Business Arrangements,” in R. L. King (ed.) Marketing and the New Science of P1annin (American Marketing Association, 1968), pp. 460-67.
3. Nunnally, J. C., Psychometric Theory (New York: McGraw-Hill Book Company,
1967).
i. Sheth, J. N.,”Using Factor Analysis to Estimate Parameters,” Journal of American Statistical Association, Vol. 514, September 1969, pp. 808—822.