

Jagdish N. Sheth, Arthur LeClaire Jr. & David Wachspress
A field experiment was carried out in four regions to measure the impact of asking race information in a mail survey. The six-page questionnaire was identical between Control and test groups except for the addition of questions on race information. The response rates for both groups were identical.
There seems to be very little empirical research assessing the impact of asking race information in mail surveys. For example, in an exhaustive annotated bibliography on mail surveys. Potter et al. (1972) failed to report a single study on this issue. Similarly, a careful review of the literature since the Potter report also failed to discover any empirical research on the topic.
There are a large number of studies when one looks at all areas of survey research including personal interviews, telephone interviews, and omnibus surveys which discuss or measure response effects in survey data attributable to race as a demographic characteristic. For example, Sudman and Bradburn (1974), in a treatise on response effects in surveys, report more than 100 studies which discuss or measure the effect of race on survey responses. However, all of these studies are concerned with bias or difference in responses obtained due to the race or ethnic background of the respondent or interviewer or due to their interaction process. Furthermore, most of these studies were limited to personal interviews and seem clearly a consequence of the classic work in the area by Hyman (1954) and Katz (1942).
None of these studies, however, measures the impact of asking race information regardless of the respondent’s ethnic background. We do seem to have several studies which measure the effects of asking other personal information such as age, sex, and especially income as well as the more recent stream of research on how to ask threatening questions related to sex and drinking (Sudman et al. 1978).
There can be several explanations for this lack of empirical research. First, most researchers might have presumed that race is a sensitive demographic information which will generate both noncooperation and biased answers in a mail survey. Second, researchers might have presumed that asking race information from a respondent may be illegal or at least may have legal implications to the detriment of the researcher. Finally, since personal interviews have dominated as a survey technique until recently, there was no need to ask such information as the interviewer could visibly assess the respondent’s race.
However, gathering information about the race of the respondent is very important in survey research for several reasons. First, race as a demographic variable is as fundamental and influential as age and sex in determining both life-styles and consumption styles (Sheth 1977). Second, many ethnic subcultures in the United States are large enough to warrant special attention and treatment as unique segments with special wants and needs from a public policy and commercial practice viewpoint. Finally, the switch to telephone interviewing and revival of mail surveys as methods of data collection in survey research have necessitated asking for race information since it cannot be observed.
Study Design
A research study, therefore, was planned to measure the impact of asking race information in terms of response rate or degree of cooperation. This study was part of a larger market research program at AT&T Company which consists of maintaining a national longitudinal panel of about 90,000 residential telephone customers. These customers are surveyed every two to three years by mail and asked to provide household demographic information as well as perceptions and attitudes toward telephone services. The national panel is drawn from nearly ICO geographical areas of the United States which represent the Bell System territory of telecommunication services.
Since prior research has found significant regional differences with respect to both demographics as well as telephone services among Bell System residential customers, it was decided that the impact of asking race information should be measured at both the regional and national level. Accordingly, four geographical markets were chosen, each representing a region of the country. The choice of the specific market was partly based on cluster analysis of all markets within a region, and partly on the degree of cooperation which could be obtained from the Local Bell operating telephone companies. The four markets essentially represented the northern, southwestern, eastern, and western United States.
In each market, a random sample of 300 telephone customers was selected. Each sample was then further subdivided into two groups—a control and test group. Thus, at a national level, the total sample consisted of 1,200 telephone customers split into the two subgroups (control and test) of 600 customers each.
The questionnaire was identical between the control and test subgroups except that the latter was asked to provide race information on a check list question. The race information question was part of a broader question in which the respondent was asked to describe himself or herself with respect to age, sex, relationship to head of household, and ethnic background. The question was placed at the end of the questionnaire and was preceded by a family income question.
The exact content and format of the question was:
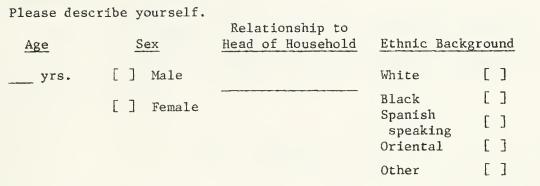
The full questionnaire was six pages long with four separate sections. The first section contained several interest-arousing questions about the telephone services. The second section contained quest ions related to the respondent’s home (type and size of home. own or rent, and length of residence). The third section consisted of questions relating to the telephone services (number and type of telephone, usage of phone. and calling patterns). The final section asked the respondent to describe household demographics such as the age, sex, marital status, education and occupation of household, family income, and personal characteristics as described above.
The mailing and follow-up procedure utilized were developed from an earlier study (Roscoe, Lang. and Sheth 1975). It consisted of mailing the questionnaire with a personal cover letter written by the local telephone manager and followed up by a telephone reminder and a second mailing to those who did not respond within a prespecified interval. The questionnaire was addressed to the subscriber in whose name the telephone was listed.
The cover letter asked that the head of household fill it out, and only if he/she was unable should it be filled out by another adult in the household.
All the questionnaires were collected and tabulated if they were returned in a prepaid envelope and arrived at the office within two weeks of the final deadline date.
Results and Discussion
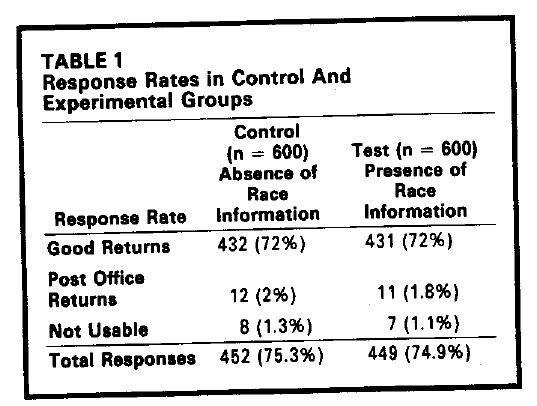
The response rates from each of the four markets and for each of the two subgroups (control and test) are summarized in Table 1. The results clearly indicate that there was virtually no impact of asking race information on the response rate. At the aggregate level, both control and test groups had a total response rate of about 75% returns.
There were, however, some regional differences between control and test groups especially in areas two and three. In area two (northern United States), the test group produced a total response rate of only 76% as compared to 83% in the control group. On the other hand, we received just the opposite results in region three (southwestern United States). The test group produced a total response rate of 69% as compared to only 63% in the control group. Since neither of these differences is substantial, it is concluded that asking race information produced neither positive nor negative effects on the response rate.
To insure that other factors were not suppressing any potential impact of asking race information, the total response rate was partitioned into (1) those which could not be delivered to the respondent, (2) those which were not usable due to only partial completion of the questionnaire, and (3) those which were deemed as good returns suitable for statistical analysis. These breakdowns also are provided in Table 1. They also indicate that there were no substantial differences in receiving (he mail survey or in the quality of responses to negate the conclusions that asking race information produces no effect on response rate.
At this point, it is worth noting that the response rate varies much more as a function of the region of the country than as a function of asking race information. For example, the range across regions in both control and test groups combined went from a low of 63% in area three to a high of 81% in area one with respect to good and valid returns. However, the range of difference in response rate between control and test groups went from a low of zero percent in area one to a high of 5% in area two. This finding of greater variability in response rates across regions of the country is in line with a previous study on the same population by Sheth and Roscoe (1975).
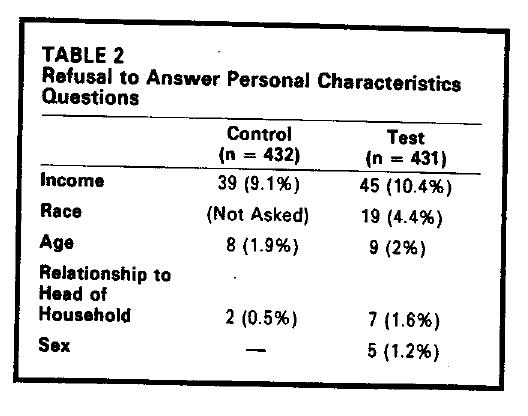
We also analyzed responses to several other demographic questions which are considered sensitive or threatening to the respondent in order to compare their refusal and no answer patterns with those for the race questions. The results are summarized in Table 2 at the aggregate level for both the control and the test groups. In both the groups, the highest refusal rate was for the income question, and it was virtually the same indicating comparability of the test and control groups. The refusal rate for the race question was only 4.4% in the test group where it was included. Finally, the refusal rates in both control and test groups were very low for other sensitive questions related to age, sex, and respondent’s relationship to the household head.
We then examined those respondents in the test group who had refused to answer the race question to see whether their refusal was motivated by the specific piece of information asked or whether it was part of a general refusal syndrome. This was accomplished by cross-tabulating refusal responses to the race questions with those to other personal demographic questions. We found that four out of five who refused to answer the sex question also refused to answer the race question (80%). Similarly, six out of seven persons who refused to provide information on relationship to household head also refused to provide race information (86%). This would suggest that those who refused to provide race information had a more general refusal syndrome. In other words, there is a very small minority of respondents (less than 5%) who like to cooperate in a mail survey, but wish not to be identified on the basis of sex, age, relationship to household head, and race.
In summary, there seemed to be no negative impact of asking race information in this mail survey on the overall response rate as well as on the quality of other personal information. In general, there was a small percentage of respondents who cooperated in the survey, but refused 10 answer the race information as a pan of a general refusal syndrome to answer all personal questions. Since this was a test study, it was decided to include the race question in the general survey of the longitudinal panel of 90,000 residential customers. It is interesting to note that in our returns we have received very few complaints which can be attributed to asking the race information.
Despite the positive experience obtained in this study and the eventual implementation of asking race information on a regular basis with no negative effects, it is important to point out the results may not be fully generalizable to other situations. First, the response rates for the telephone company studies generally tend to be substantially higher than the average response rates to all other mail surveys. This may be due to greater interest or involvement in the product or perhaps due to the personal relationship established with the local telephone company in terms of monthly bills and continued accessibility to the local phone company office. Second, the other parts of the questionnaire were all rather well-known and familiar questions related to the telephones, housing, socioeconomic-demographic information, and life-styles or psychographics. One would expect a greater refusal rate on the race and other personal questions if the respondents did not have a positive attitude toward the researcher or the product in question, and if the questionnaire also contained questions which were highly threatening or sensitive to the respondents.
References
Hyman. H. H. (1954). Interviewing in, Social Research, Chicago: University of Chicago Press.
Katz, D. (1942), “DO Interviewers Bias Poll Results?” Public Opinion, Quarterly. 6, 248-268.
Potter, D. R. et. al. (1972), Questionnaires for Research: An Annotated Bibliography on Design. Construction, and Use, Portland, OR: U.S. Department of Agriculture.
Roscoe, A. M., Dorothy Lang, and J. N. Sheth (1975). “Follow up Methods, Questionnaire Length, and Market Differences In Mail Surveys.” Journal of Marketing, 39 (April), 20-27.
Sheth, J. N. (1977). “Role of Demographics in Consumer Behavior,” Journal of Business Research, 5 (June), 129-138.
——— and A. M. Roscoe (1975), “Impact of Questionnaire Length. Follow up Methods and Geographical Location on Response Rate to a Mail Survey.” Journal of Applied Psychology, 60. 252-254.
Sudman, S. and N. M. Bradburn (1974), Response Effects in Surveys, Chicago: Aldine Publishing Company.
———–, ———-, E. Blair, and W. Locander. (1978), “How to Ask Questions about Drinking and Sex: Response Effect, to Threatening Questions.” Paper presented at the 82nd APA Convention, San Francisco.