

A. Marvin Roscoe. Jr, Jagdish N. Sheth, and Welling Howell
Clustering methods are often used in marketing research to define homogeneous market segments. It should be determined in these studies that the derived clusters represent actual dusters. However, replication or external validation is not always practical. An alternative procedure, cross-validation using Intertechnique comparisons, is described in a study of geographical market heterogeneity for the telephone industry.
Cross-validation among techniques seems essential in cluster analysis because most clustering methods tend to be heuristic algorithms instead of analytically optimal solutions. 1 As heuristic algorithms, they have no sampling theory for statistical inferences about the size and the number of clusters. Also, there are no external validation procedures to ensure that the clusters derived from a specific cluster analysis are, in reality, the true invariant clusters. The potential statistical problem of obtaining artifacts as clusters is further compounded in some procedures which require a priori assumptions about the size and the number of clusters. Although a number of clustering methods perform statistical tests such as the F ratio or Wilks’ Lambda based on analysis of variance principles to guard against obtaining random solutions, no procedure exists which will increase the assurance that a nonrandom cluster solution is in fact the true cluster solutions.
Because clustering methods are used in marketing research to identify homogeneous market segments for selective marketing efforts, it is critical that the clusters derived from a heuristic algorithm are the true clusters. One procedure to ensure cluster invariance is replication which, however, is not always practical. Another procedure is the common practice in psychometrics of cross-validating the results by external validation. Surprisingly, there are very few studies in which cross-validation has been utilized to ensure that the derived dusters are indeed invariant.
Although several studies have pointed out the dramatic changes in the cluster structures as a function of data input [4, 8], there seems to be only one published study to our knowledge which has examined the question of intertechnique validation of clusters [3].
The objective of this paper is to describe, a cross- validation procedure which utilizes intertechnique comparisons of the clustering results. Although the actual study entailed applications of five different clustering techniques, our discussion is limited to two techniques in this paper due to space limitations. A brief description of the large scale research project is provided in which the clustering results were essential to formulating an experimental design for a field experiment.
Description Of The Study
The major research study consisted of a three factorial-64 cell experimentation on survey research methods. The three factors were: (1) two different lengths of the questionnaire; (2) four different follow. up procedure; and. (3) the market heterogeneity of geographical areas of the United States with respect to consumer telephone behavior and socioeconomic- demographic characteristics [9]- The levels of the first two factors were predetermined based on theory, prior research and practical implications for the ongoing research on a longitudinal national panel of telephone customers. For the third factor, it was necessary to determine the heterogeneity of the markets by empirical research which utilized clustering methods.
To define the market heterogeneity, profile data on 30,000 residential telephone customers were used for clustering. These customers are part of a longitudinal consumer panel called the Marketing Research Information System which is maintained for the Bell System by AT&T. The panel members are selected based on a multi staged stratified sample in which the first stage of the sampling procedure consists of 100 Revenue Accounting Offices (RAOs) representing the entire Bell System. The profile consists of essentially three types of information about each panel member: (a) his socioeconomic – demographic status and housing characteristics determined by a survey conducted in early 1970 and matched with the 1970 Census, (b) his monthly- telephone behavior broken down into several categories as determined by the industry practice, and (c) an inventory of his telephone equipment including number and types of telephones, and additional services.
Since it was required to empirically investigate the geographical heterogeneity of the markets, an average profile of the residential telephone customers was determined for each of the 86 RAOs for which detailed and complete information was available.
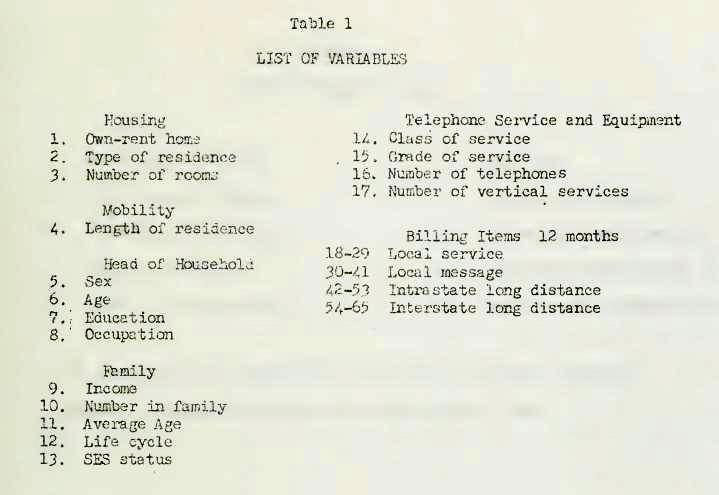
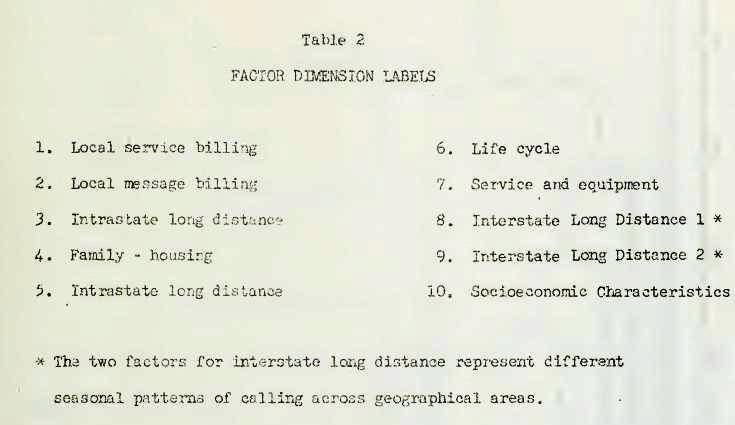
A total of 65 customer descriptors were used to represent the total profile of customers. A list of the variables is shown in Table 1. A factor analysis (principal components) solution with orthogonal Varimax rotation was performed on the data for the following reasons: (a) to reduce the multicollinearity among variables so that the profile consisted of orthogonal factor scores which are geometrically essential to calculate Euclidian distances, (b) to equalize the relative weights of each of the underlying dimensions which could otherwise be easily changed by arbitrary dropping or adding of profile variables, and (c) to standardize the diverse scales of measurement common across the socioeconomic, demographic and telephone information [7]. Ten significant factors were extracted from the analysis which summarized 92 percent of the total variance. A brief description of the factors is provided in Table 2.
The number of significant factors was determined using several criteria, both statistical and judgmental, following the recommendations of Rummel [10]. In addition, the stability of the factor structure was also determined by comparing the results with other data analyses to ensure the invariance of the fundamental dimensionality and structure of the profile data.
The standardized rotated factor scores for each RAO were then utilized to compute Euclidian distances “between all combinations of RAOs. The resultant 86 X 86 distance matrix became the input to the clustering procedures.
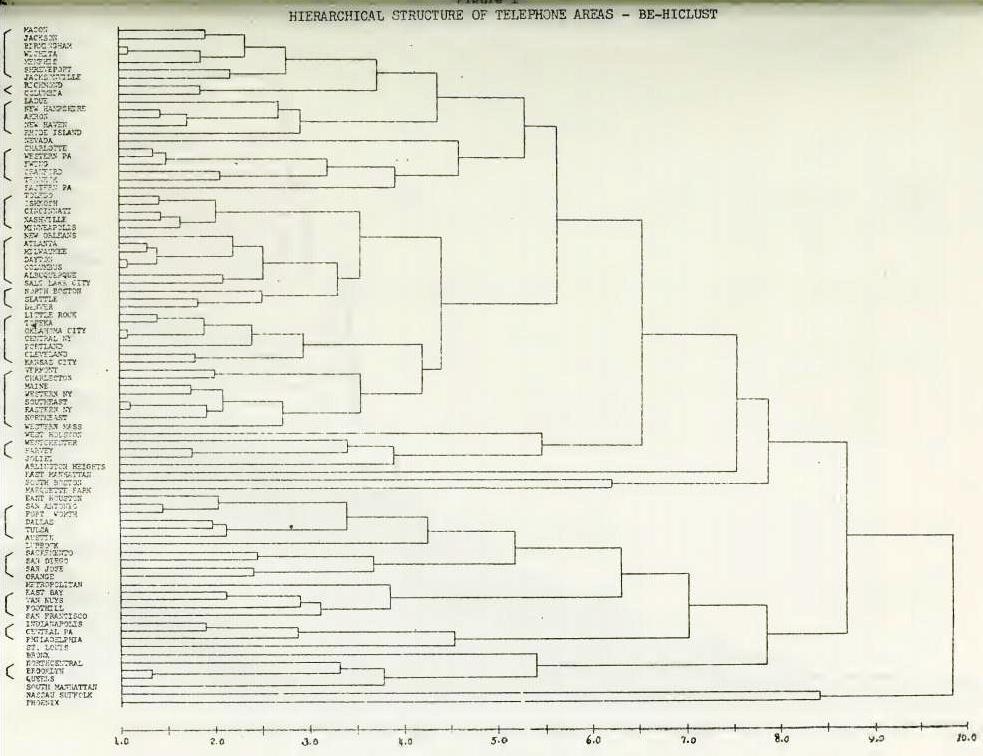
Due to the following distinct advantages, Johnson’s Hierarchical Clustering method [5] was chosen as the primary clustering technique for determining the market heterogeneity. First, it is strictly empirical; second, no prior assumptions are required on the part of the researcher; and third, a hierarchical display is provided of the clusters being formed based on a function minimizing the pairwise distances among entities. While the size of the distance matrix is a limitation of the technique, it was not a problem in our case because of the relatively small number of RAOs to be clustered. Due to the structure of the distance matrix and the presumption of the “ultrametric inequality”, [5 p. 248-9] the diameter method was chosen instead of the connectedness method in the Be-HICLUST solutions. The results are diagramed in Figure 1.
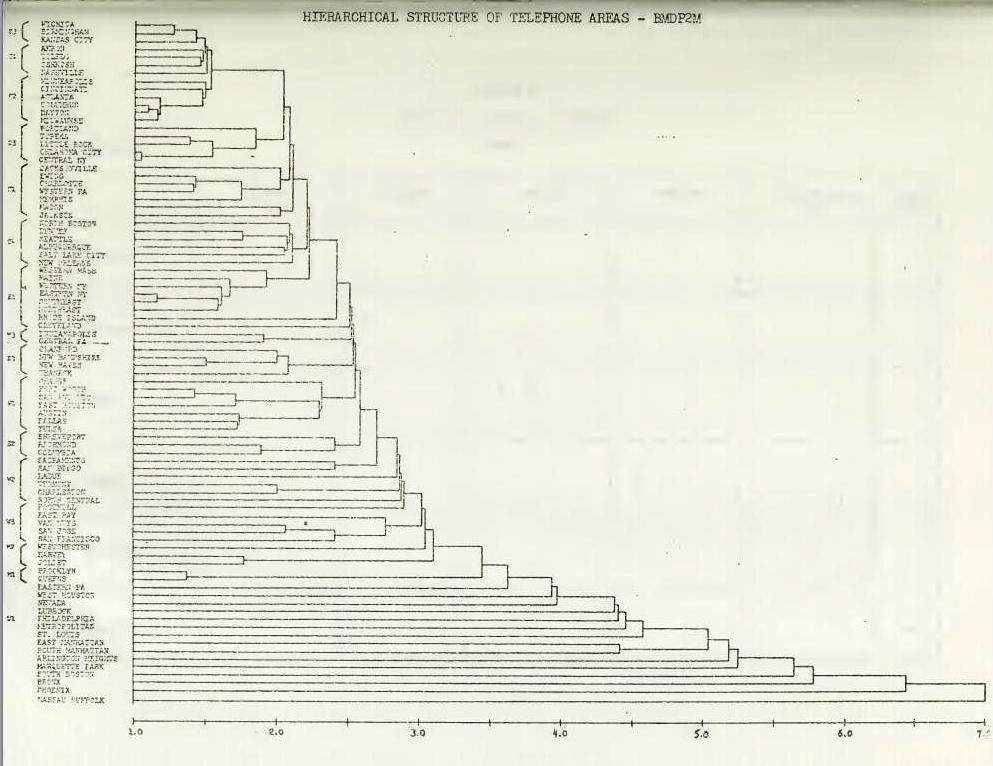
While the hierarchical clusters from HICLUST were meaningful, and had strong face validity, it was necessary to cross-validate the results by at least one other technique which was essentially similarly its input requirements, analytic strategies and the output- format. For this we chose the cluster analysis program developed as part of the BMDP Series which is also a hierarchical clustering routine based on sum of squares distances and the amalgamation principle [1]. In short, BMDP2M amalgamates entities based on the criterion of the smallest distance. Once a cluster is formed, consisting of at least two entities, it calculates the average profile of the cluster and treats it as if it were a new entity which is then clustered with other entities or clusters based on the principle of smallest distances. The process continues until all entities and clusters are hierarchically linked at different levels of distances. The results of the BMDP2M analysis are diagramed in Figure 2.
As can be seen, the two hierarchical clusters are similar in their structure and hierarchy suggesting that there is a good cross-validation between the two analyses. In order to quantitatively assess the degree of congruence between the two hierarchical clusters, two distinct statistical procedures were utilized. The first procedure consisted of calculating the correlation coefficient for the two distributions of distances at which linkages were made between entities or clusters in each hierarchical analysis. Since the number of linkages is not likely to be identical, we have selected the maximum number of links of one technique and the corresponding number of the other technique. The correlation coefficient between the sequential linkage distances is 0.994 which is highly positive indicating extreme closeness of the hierarchical structure of the two cluster analyses.
Another procedure for cross-validation consisted of examining the cluster developed at some specific levels of distances. Based on the plotting of distances at which linkages were made, for the BE-HICLUST results a distance of 5.0 was indicated as a cutoff point due to the natural break in the curve suggesting a clear truncation.
The linkage for the BMDP2M results were also plotted and the natural break in the linkages occurred at 3.1. This was at the point where all the clusters had been formed. After this point the BMDP2M analysis indicated 15 unique entitle that were not identified with any of the defined clusters. In order to produce comparable results, the cutoff point for the BE-HICLUST diagram was moved to 3.5 for the cross-validation. The clusters could be identified by their geographical orientation and have been labeled Eastern, Southern, Central and Western. Metropolitan has been used for large urban areas not specifically associated with regional areas. The clusters derived from the two techniques are marked in Figures 1 and 2 and are cross-tabulated in Table 3.
Table 3
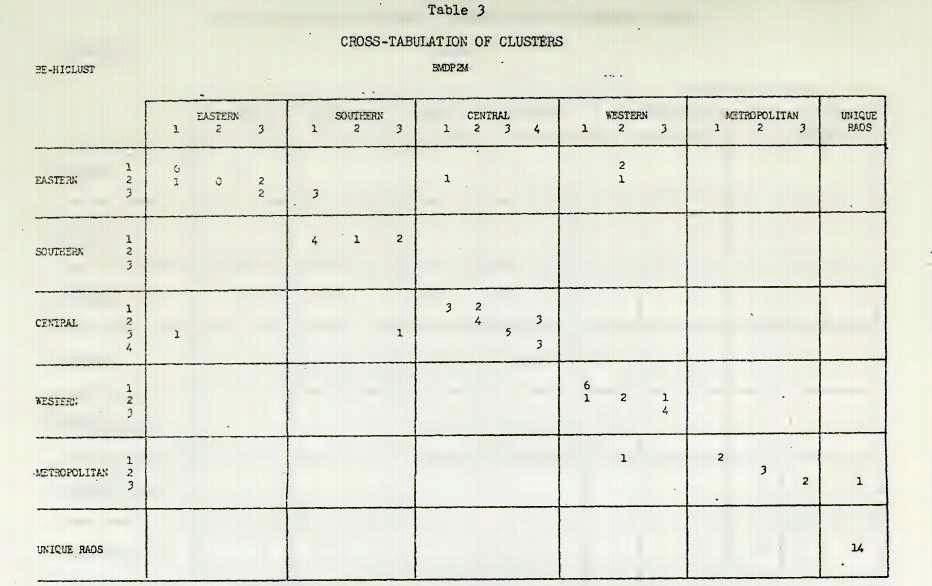
Table 4

A total of IT clusters are displayed in Table 3, consisting of 13 regional clusters (Eastern, Southern, Central and Western), three metropolitan cities clusters and the last one representing all the unique RAOs which could not be clustered due to their extreme distances from other RAOs, The cross-tabulation between HICLU3T and BMDP2M clustering results indicates that 62 out of 86 RAOs fell on the diagonal of the crosstab matrix which represents a hit of 72 percent correct classifications in terms of intertechnique results. Furthermore, most of the off-diagonal elements generally fall across clusters within the same geographical region- In Table 4, a cross- tabulation at the regional level is provided which shows that 75 out of 36 RAOs could be correctly classified on an intertechnique basis. This represents a hit of 72 percent.
While the two results are quite comparable, there are differences in the example worth noting. The BE-HICLUST algorithm appears to provide a more logical structure to the clusters which are grouped by region as indicated in Figure 2. In addition, the BE-HICLUST method seems to work better where large distances are involved, associating 8 of the 14 unique entities with meaningful clusters. Such differences reinforce the need to use several techniques and to understand the advantages of each especially where the researcher’s judgment plays such an important role.
Summary And Conclusions
We have pointed out the need for intertechnique cross-validation in cluster analysis due to the heuristic nature of most clustering procedures and the judgmental decisions required to interpret the results. In this paper, we have also presented a concrete application of two statistical procedures which enable the researcher to quantitatively measure the congruence of structure and content of clusters across techniques. The first consists of a correlation coefficient index calculated on the distributions of distances at which sequential linkages are made among entities or clusters or both. The second consists of a cross-tabulation of specific clusters derived across two different solutions. In this paper the intertechnique cross-validation procedures have been applied with respect to two hierarchical clustering procedures in which the problem was the determination of geographical heterogeneity of markets for the telephone industry.
References
- See Joyce and Channon (6) and Frank and Green (2) for a review of the numerous clustering methods available today. ↩