


By Jagdish N. Sheth and Banwari Mittal | This article reports on the public perceptions of the quality of health care services offered by three categories of provider professionals (physicians, dentists and pharmacists) add three categories of hospitals (public, private, and those with religious affiliations). The authors examine quality along two dimensions: the quality of “cure” vs. the quality of “caring.” Results show that, although the health care industry does a fairly decent job in delivering quality service, there is uneven performance across different providers. Data also show the quality of caring to be lagging the quality of cure; importantly, however, the former is more influential in earning patient loyalty. The role of the two types of quality in patient retention are presented, along with implications for health care industry managers.
The American health care industry has undergone tremendous changes over the last two decades. Cost containment, managed care, the growth of HMOs, PPOs and other insurance arrangements—these developments present consumers with more options as well as constraints. Even though there are more choices of providers available in the marketplace, as least theoretically, these choices are constrained by variously restrictive employer insurance plans or by rigorous monitoring and control by cost-conscious insurance agencies.
Given the increasingly competitive marketplace, physicians and hospitals strive to keep their customers satisfied, but increasing cost pressures encourage “assembly-line” delivery of health care. Al the same time, consumers have become more conscious of their rights to get good service, and they are demanding better of their doctors and other providers. In this market scenario, how well is the health care industry serving the Americas consumer?
We sought: to answer this question by surveying a national sample of American consumers regarding their perception of the service quality they receive from their health care providers. Specifically we included three health care professionals: physicians, dentists, and pharmacists.
Physicians are of paramount importance to everyone and consumers depend on them for their physical well-being. Therefore, an assessment of consumer perceptions of their physician’s service quality should be of interest to most health care marketers and public policy makers.
Dentists are another important group of providers, even though every consumer may not be using their services. Because of more intense competition, however, dentists are becoming more customer-oriented, and we wanted to assess their consumer ratings compared to physicians.
Finally, pharmacists are becoming an important category of professionals because consumers increasingly look to their pharmacists for medication information, especially for non-prescribed drugs.
We also assessed three kinds of health care institutions: public hospitals, private hospitals, and hospitals with religious affiliation. We wanted to see if health care institutions scored better or poorer in customer ratings than health care professionals and whether there were differences between the three types of hospitals themselves. For all six types of health care professionals and institutions, we assessed perceived quality as well as consumer satisfaction and loyalty.
Based on these data and on the demographics of our respondents, we profiled the health of the American health care industry as judged by the consumer it strives to serve. Our report is positive acknowledging the health providers’ generally good quality: but it also points to the presence of a significant proportion of consumers who are not satisfied. We identify these consumers by their deegories of consumers. For example, for physicians among the retired consumers only 11.8% were switching prone compared with 25.4% among the full-time employed and 23.3%’ among the part time working or non-working consumers.
In general there was a tendency for consumers in larger markets (population 500,000 or more) to be more switching prone than their counterparts in towns and cities of smaller sizes. While present this difference was notable and significant only for the pharmacists and public hospitals. For these services, the small towns seemed to offer a better climate of loyalty towards the service provider.
Discussion
For both the categories of health services— health care professionals and hospitals—a substantial proportion of consumers (ranging from 49%-66%) rated service quality to be a 9 or 10. Only a small minority (6%-l7%) rated the service less than or equal to a 5. This comforting broad picture is marred somewhat by a switching propensity of about one-fourth to one-third. Thirty-four percent of the consumers expressed an interest in switching their public hospitals to receive better products and services.
As a group health care professionals fazed better than did hospitals. For example, the poor quality scores (5 or less) were given to provider professionals by only 7.6% or fewer respondents: in comparison, similar scores were given to hospitals by 11.8% to 17% of the respondents. Accordingly, the Switching rates too were substantially lower for professionals (l8%-24%) than for hospitals (28%-34%). Among the professionals, dentists fared she best, with a S or lower rating given by only 6,2% of the respondents and a switching proneness rate of 18%. Physicians and pharmacists fared about the same, with physicians showing a slight edge. Among the three kinds of hospitals, public hospitals fared the poorest, with low quality scores by 17% and a switching rate of 34%. Private and religious hospitals fared about the same.
The caring aspect of service suffered compared’ to the curing aspect for all services, although this deficit was numerically small (yet statistically significant). Beyond an acceptable level (a 7 in our analysis), further improvement in quality was more effective in reducing the switching rate when the improvement was in the quality of caring rather than in the quality of cure.
Finally, the switching-prone customers differed in their demographic makeup from the more loyal consumers. Switching prone consumers tended to be younger, never married. Asians and other minorities more educated, from higher income groups, fully employed, and residents of larger metropolitan areas.
Management Implications
A switching rate of 30% (or hospitals may or may not be deemed high and alarming, yet it does present some cause for concern because it reflects the public’s dissatisfaction with its health care providers and represents an annual loss of customers. Note that the switching-proneness rates reported here do not include possible involuntary switching (i.e. due to change in insurance plans. job relocation. etc.).
The demographic profile of switching prone consumers is noteworthy. Younger upper-income, upper-education, and full-time employed con- sunsets are more prone to switching. Perhaps their reason for switching is less likely to be simple price advantage (especially since, for most of the population, the costs of health care services are not directly charged to the consumer), but rather a desire for better products and services.
To satisfy and retain clients, service quality has to be rated a 9 or 10. This is where the loyalty rates of 80% or higher are seen. To our surprise, about 50%-65% of all consumers rate their health care service providers in this high range. While the low ratings of 5 or less are received by these services only from a small proportion of consumers, the middle scores of 6, 7, and 8 are barely sufficient in retaining customers. Our results show that more than 90% of the variance in consumers’ switching propensity could be explained by the quality of service they received. Thus, quality in health care services pays off.
Health care professionals must pay attention to both quality of cure and of caring. But once a cians, the index is 99 (or whites and 96 for African-Americans; in contrast, it is 223 for Asian-Americans and 137 for “other” race groups. Thus Asian-Americans are more than twice as likely to switch than is the population at a whole.
Whites were found to be more switching prone than blacks except (cc public hospitals where the pattern was reversed. However, this difference was marginal for health care professionals, and it was most substantial foe religious hospitals.
For most services, never-married consumers were more switching prone than both of the other two groups (now- married and separated / divorced). However, this difference was statistically significant only for the three health care professionals and public hospitals, but not for private and religious hospitals.
Age difference was very pronounced. Younger consumers were substantially more likely to be switching prone than were older consumers. Consumers ages 50 or younger were much more likely to switch than were those older than age 50. Furthermore, even among the latter group, consumers ages 51-65 were more likely to switch than were consumers older than age 65. The age difference was statistically significant for all six services.
Education was positively correlated with switching proneness. Consumers with high school diplomas or less education were much less inclined to switch than were those with some College education. This was the case for all services. The effects of education were most marked in a contrast between the two extreme groups—high school or less vs. post-graduate. Nonetheless, the middle group of some college education” also showed she tendency to switch compared to the lower educational group. This tendency was statistically significant (or a number of services. (e.g.. physicians and pharmacists, private and religious hospitals).
Income also was positively related with switching proneness. The lowest-income group of consumers (425K) was the least switching prone for five out of six services (the exception was for dentists). As to the distinction between the two higher income groups, consumers showed more switching proneness if they were from the upper-income group than from the middle-income group for the following services: religious and public hospitals, dentists, and pharmacists. In contrast, foe physicians and private hospitals, the middle-income group was more switching prone than was the higher-income group.
For all six health care services, full-time employed respondents were more switching prone than either part-time employed or non-working respondents. Furthermore, retired consumers were much less switching prone than were all other cat- mographics. We also examine the relative roles of the quality of “cure” vs. the quality of “caring” in wining customer loyalty.
The survey
The survey was conducted on a national mail panel in the United States as part of an omnibus survey. The total sample size was 3.650. We asked consumers to rate various types of health care professionals and institutions; the present report focuses on the six most important of these.
In the survey, we asked two questions relating to customers’ perceptions of quality and asked respondents to rate the quality of service these professionals and institutions provided and, to rate the way they provided the service. In other words, these are ratings of what service is provided and of how the service is provided. A third question also was asked: “Would you switch providers to get better Products and services” We asked these quality and switching questions only of those who had contact with a health care professionals or institution within the past year.
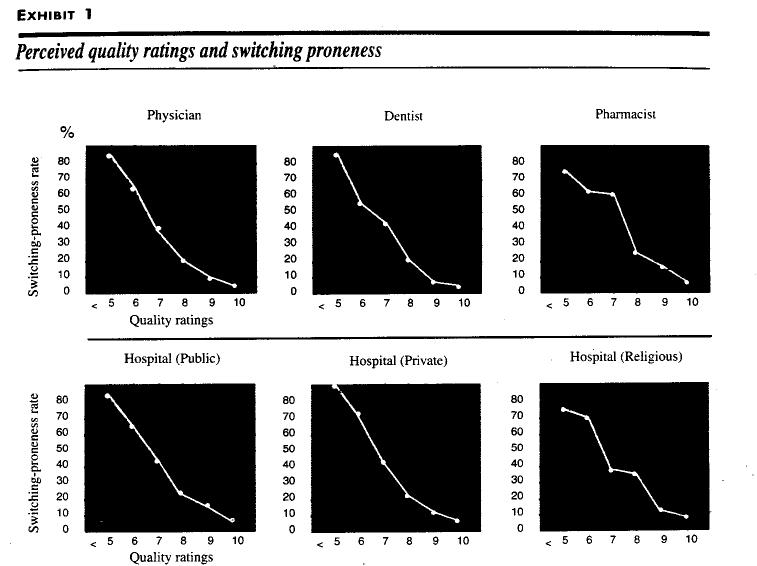
To score various services on perceived quality, the two quality questions were averaged. On a 0-10 scale, a score of less than 5 was considered “poor’ and 9 and 10 were “excellent.” Accordingly, percentage of respondents who rated a service less than or equal to 5, as well as those giving it a 9 or a 10 (computed as the average of the two quality-related questions), are shown in Exhibit 1.
The perceived quality varied considerably across the six health care providers surveyed. A score of 5 or less was given by fewer than 17% of the respondents. At the high-end of the rating scale. a score of 9 or 10 was given by more than half of the respondents (except in one case, by 49.2%) for all of the six services, Two patterns are noteworthy: Health care professionals (physicians, dentists. and pharmacists) received a better rating than did the hospital facilities and, among the hospitals, private and religious hospitals received a somewhat better score than did public hospitals.
Based on the question. “Would you switch providers to get better products or services.” we computed the percentage of respondents who said that they, would switch. Potential switching rates range from 18%-24% for health care professionals and from 28%- 34% for provider hospitals. Among the three categories of professionals dentists score the best (with the low switching rate of 18%). Among the hospitals, the switching rate is higher for public (34%) than for private (30,2%) and religious (28.3%) hospitals.
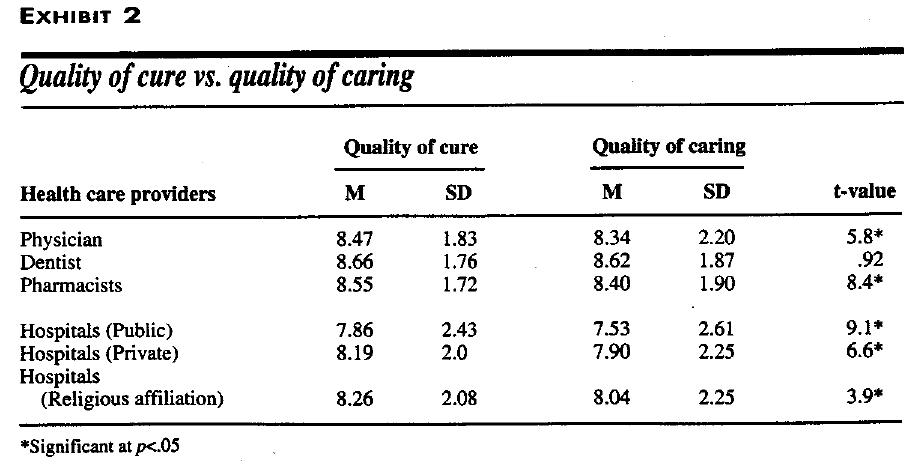
Recall that we had measured perceived quality by two questions, which concerned the quality of cure and the quality of caring. Exhibit 2 on page 32 presents the mean value on these two measures. In each and every case, the quality of caring was somewhat inferior to the quality of cure, and this difference was statistically significant for all but dental care service. For dentists, the caring quality was as good as the cure quality. For the other five services, this result about the trailing score on the caring quality is noteworthy. The caring quality essentially reflects the quality of the encounter or contact between the service employee and the customer.
In our survey, the quality of contact was always judged to be inferior or lacking, compared to the quality of what was offered. Furthermore, on both the quality of cure as well as caring, dentists fared best, pharmacists were next, and physicians had the lowest score of the three health care professionals. Among the hospitals, religious hospitals fared the best, private hospitals followed, and public hospitals scored the worst on both the cure and caring quality.
Potential switching rates are strongly correlated inversely with the perceived quality for all six services. This relationship is shown for each of the six selected services in Exhibit 1.
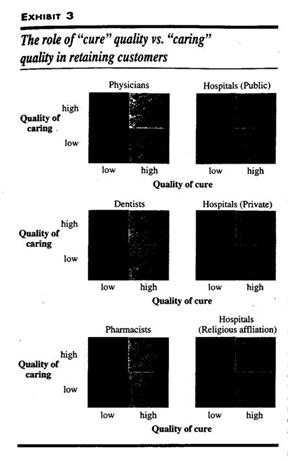
Quadrants two and three represent customers who rated one aspect of the service but not both above seven. Next, for each quadrant, we computed the Percentage of those willing to switch, that exhibit shows, when both the dimensions of quality are scored low (below or equal to seven), the switching propensity Is high—ranging from 62.2% for pharmacists to 78.8% for private hospitals. But improving both the dimensions to a score of eight or higher would result in a decline in switching propensity to nearly 13% or lower.
Once the acceptable level of seven is achieved on both dimensions, the next improvement pays off slightly better if it is in the caring rather than in the cure aspect of service. For the physician service, for example, high cure/low caring will increase the switching propensity rate to 45.1%. In comparison, improving the caring while keeping the cure at the seven or less level would reduce switching rare to 37.6%.
As another, even more vivid, example, consider public hospitals. The high switching rate of 72.2% in quadrant one drops only to 59.1% (about a 20% decline) in quadrant two—the quadrant corresponding to high cure and low caring quality. In comparison, the switching rate drops to 17.4% (about a 76% decline) in quadrant three, which represents high caring/low cure quality. Note that the switching rates are lower in quadrant three than in quadrant two for all six services. Moreover, this difference is statistically significant (at pc.0S) for all six services. We repeated the entire analysis for all services with a cut-off level of eight. All of the patterns were replicated.
Were the demographics of those more likely to switch different from those not likely to switch? To examine this, we cross-tabulated, individually for each service, the switchers and nonswitchers against each of the several demographics measured. It is best to present these data in index fonts, which is computed as follows. Consider male-fem ale differences for physicians. For die total sample, the switching rate is 22.2%: among males and females it is 21% and 22.8%. Therefore, the index for males is (100 x 2l/22.2=95): among females it is (100 x 22.8/22.2 = 103). The indices are easy to interpret. For example, since we know that the switching rate for public hospitals is 34% an index for, say, married respondents of 200, would translate to a switching rate of 68% and an index of 50 would translate so a switching rate of 17%.
Gender differences were nonsignificant for all of the health care services: statistically speaking males and females were equally likely to switch service providers. In numerical terms, males were slightly less likely than females to switch physicians, dentists, and private hospitals, whereas the converse was the pattern for pharmacists, public and religious hospitals.
Significant differences were noticed on race. For services for which we obtained substantial Asian-American and “other” race respondents reporting a contact, we found Asian-Americans to be the highest and the “other” race groups to be the second highest in their switching proneness (except that for pharmacists. “other” race respondents were slightly more switching prone than were Asian-Americans). Illustratively, for physics good quality level is reached on both (a score of 7 or 8), further improvement in the quality of caring is likely to pay off better than a similar improvement in the quality of cure. Of course, if resources exist to raise both the qualities, so much the better.
The two qualities entail different resources. The cure quality requires technically competent physicians and paramedical staff, cutting-edge equipment investment in information manage, mere systems, and an adequate physical plant. The caring quality requires investments in creating a service culture where customers come first and where all personnel (physicians, nurses, paramedical. and clerical) have interpersonal skills and a caring attitude. Both types of quality would require investments in adequate capacity so that neither facilities nor personnel are overloaded and strained.
The demographic profile of health care consumers who are prone to switching their providers also holds implications for health care managers. Such consumers are younger, more educated, make good money, have never been married, and are employed full time. Also, Asian-Americans and other minorities tend to be more switching prone. These customers tend to be more demanding and lets tolerant of poor quality. Therefore, health care providers should pay special attention to quality when serving these customer groups. Moreover, because the quality of caring matters more than the quality of cure, health care professionals need to be vigilant and more customer- friendly in face-to-face interactions with these customer groups. This does not imply dilution of service quality to other customer groups, but rather an awareness of special characteristics would be helpful in responding to their desire for extra attention.
Conclusion
Foe health care providers, good service quality pays. Our data show that patient loyalty and service quality are strongly correlated. Moreover, both the quality of cure and the quality of caring matter But our data is unequivocal in showing the supreme power of the quality of caring.
There is no mistaking that patients seek remedies for their ailments, first and foremost. But in a competitive marketplace in which every provider ends up offering an adequate level of disease treatment and where the speed or extent of recovery is not always attributable to the competence of the physician or the quality of the hospital patients look so the interpersonal treatment they receive at the hands of health care personnel as a determinate of whether or not they would want to patronize that health care professional or that hospital again. It is no longer sufficient, therefore, for health care professionals to merely be technically competent. In today’s consumer-oriented society, they should excel just as much in interpersonal skills Moreover, they need to embrace an attitude of interest in their patients as people.