
A. Marvin Roscoe, Dorothy Lang, and Jagdish N. Sheth | In this experimental test a telephone reminder produced the best response rate and questionnaire length had no effect on rate of return.
Considerable progress has been made in the art of data collection and in the reduced on of nonsampling error in survey research.1 However, there are still many areas in opinion research about which little is known or the existing evidence is inconclusive. This is especially true for mail surveys, where empirical research has failed to bring about agreement on the nature or degree of influence of the factors that affect response rate.2 The authors believe there are three major reasons for this information gap: many variables influencing the response, the lack of a comprehensive theory, and the limited resources allocated to fundamental research on survey techniques.
Three aspects of mail surveys are of considerable practical importance and yet are not well understood. First, how effective are different follow-up procedures in mail surveys? Is a postcard reminder as effective as a telephone reminder? Is it better to switch to a telephone or personal interview for those respondents who do not return the mail questionnaire within a pre-specified time period? While there is a general consensus that any follow-up or prodding generates additional response.3 there is little agreement about the relative effectiveness of different follow-up procedures.
Second what is the effect of questionnaire length on the response rate? It seems logical that response rate would decrease with an increase in questionnaire length but most of the evidence to date has failed to support this hypothesis. In fact, the opposite result has been found in a number of studies.4
The third question concerns the determination of Interaction effects among questionnaire length, follow-up methods, and various respondent characteristics. For example, is one follow-up method more effective for a short questionnaire and another better for a long questionnaire? Also, are some respondents more receptive to a particular follow-up method or questionnaire length than other respondents?
Study Design
Answers to these questions about the effects of questionnaire length, follow-up method, respondent characteristics and their interactions are critical to AT&T which periodically sends a mail questionnaire to its residence customer panel of 30,000 members. These customers are asked to complete and return a four-page questionnaire; the data are used as input for AT&Ts Market Research Information System (MRIS). The 30,000 residence customers in this longitudinal panel represent all telephone users at the national and state level, and local areas within some of the larger states. To ensure representativeness of the sample in the fixed panel, it is important to maximize the questionnaire response rate.
The four-page mail questionnaire requests information on telephones and their location in the home, telephone usage, housing, mobility, demographics, and socioeconomic characteristics. Together with information from company billing records, these data are used to develop models of telephone behavior patterns. The survey procedure uses an “alert” postcard, followed by a first mailing of the questionnaire with a cover letter requesting the customer’s cooperation. Then a reminder postcard is sent followed by the mailing of a second questionnaire to those who did not fill out and return the first.5
Three years after the initial customer data were collected, the company decided to obtain more current inflammation by mailing a new questionnaire to present panel members. At the same time, the decision was made to revise the standard four-page questionnaire to determine the effects of gathering additional attitudinal information, and to test alternative methods for improving the response rate. This last concern was to guard against the generally declining response rates that had been experienced by many in survey research work.
Since past research evidence on the effects of follow-up methods and questionnaire length on response rate was not decisive, a study was initiated to investigate the individual and joint effects of these factors in a variety of market areas. One purpose of the study was to compare the present questionnaire follow-up procedure and several alternative methods under controlled conditions to determine the best procedure for increasing the response rate. A second objective was to find out if a set of attitude items could be added to the questionnaire without decreasing the response rate. The study consisted of a 2 x 4 x 8 three-factorial fixed-effect field experiment and a subsequent set of post-experiment interviews to explore customer attitudes toward the mail survey.
Test Variables
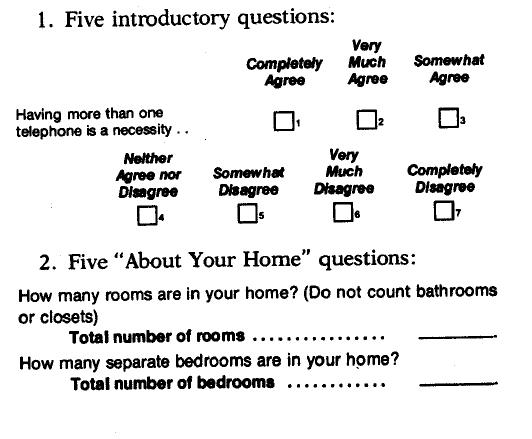
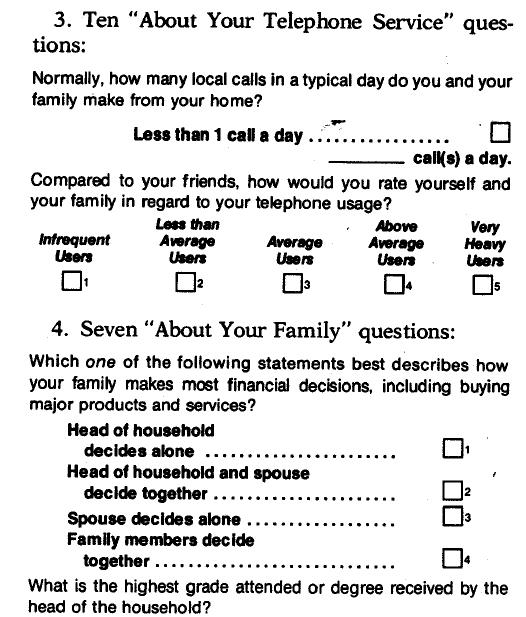
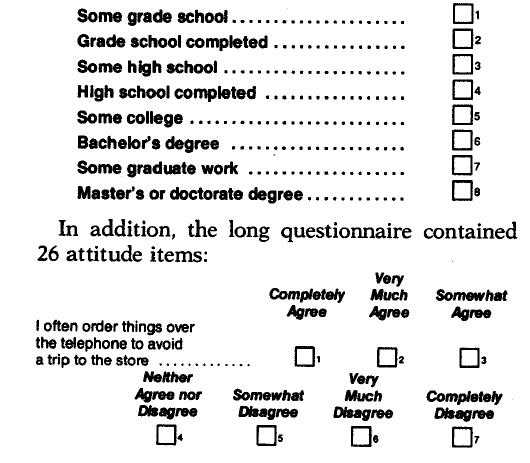
The first test variable was questionnaire length/content. Two questionnaire versions (two experimental levels) were used: a short, four-page questionnaire (slightly revised from the existing questionnaire); and along, six-page questionnaire that included additional attitudinal and perceptual questions about the telephone as a product and as a service. The short questionnaire consisted of 28 items, and the long questionnaire contained the same 28 items plus 26 attitudinal items.
All questions but one were either check-box or called for writing in or circling a number. A descriptive statement and an example are given for each of the five sections of the questionnaire. Both questionnaire versions consisted of the same first four sections:
The second experimental factor or test variable was follow-up methods. Four methods were selected as feasible alternatives after considerable exploration of the cost and convenience of various strategies. The four interviewing methods selected used a uniform postcard alert and first questionnaire mailing. The follow-up methods varied among experimental treatments and consisted of the present postcard and three new methods:
1. Present follow-up method—postcard reminder and a second mailing of the questionnaire
The postcard reminder read:
Just a Reminder…
We’d like to include your opinions with those we’ve already received about the new services and equipment we are offering.
If you have not already done so won’t you please check your answers to the questions in the questionnaire we sent you recently, and return It to us.
Thank you for your help.
[Signature of local Telephone Company Manager and Company logo.]
2. Second follow-up method—telephone reminder and a second mailing of the questionnaire
The following reminder was used:
Respondents were not given the option of answering the questionnaire over the telephone because the purpose of the study was to test the effectiveness of a telephone reminder as compared to a telephone interview, and the treatments were to be kept separate to avoid confusing the results.
3. Third follow-up method—letter alert followed by a telephone interview
The letter alert read:
Dear Customer
Recently we mailed you a copy of the enclosed questionnaire as part of an important survey among telephone users, If you have already returned the original questionnaire, this I, our way of saying “Thankyou.”
In case you were away or too busy to complete the questionnaire, an interviewer’ representing the Telephone Company will phone you during the next few days to record your reponses. Of course, all answers sit confidential and will be combined with those of other telephone users.
It would be a great help if you would keep the enclosed questionnaire near the phone for convenient reference when our interviewer calls.
I personally will be very grateful for your help.
Sincerely,
(Signature of local Telephone Company Manager)
For the telephone interview, the interviewer read the questions from the questionnaire form to the respondent when necessary and recorded the answers on that form.
4. Fourth follow-up method—telephone interview without alert
The interviewer called the respondent without advance notification and read the questions from the questionnaire form.
The third experimental factor, or test variable, was market heterogeneity. The national panel In the MRIS system Ii based on a multistage stratified sample in which the Bell System is geographically divided into 100 regions, and a sample of 300 residence customers is chosen to represent each region. Based on a hybrid multivariate cluster analysis 6 of the 100 Bell System markets in terms of socioeconomic, demographic, and telephone usage characteristics, the following eight geographical areas were chosen as representative market regions: Southeast Massachusetts; San Jose, California; Arizona; Philadelphia; Eastern Wisconsin; Suburban Chicago: Fort Worth, Texas; and Alabama. Although general regional differences in response rate among these areas were known, the study was designed to test whether or not one questionnaire version or follow-up method would be superior in one region while another would result in a higher rate of return in other geographical areas. These markets represented eight fixed levels of the third factor in the experimental design.
Questionnaires were mailed to a representative random probability sample of 264 customers in each market. Within each of these test regions, the sample was equally divided among the eight experimental conditions (two questionnaire lengths and the four follow-up procedures), with the result that each of the 64 cells In the three factorial experimental design had a sample of 33 customers.
In addition to these three experimental factors, information on respondent characteristics was obtained by using the demographic, socioeconomic, telephone usage, and attitudinal information from the questionnaire itself. These data were used to estimate the respondent attributes that could interact with questionnaire length and follow-up methods to Influence react ion to these variables.
The Study
The study began with the 2144 members of the sample receiving an alert postcard on a Monday of the first week of the survey and the questionnaire on the following Wednesday. The postcard and telephone reminder groups received a second questionnaire on Friday of the second week if the first questionnaire had not been returned.
The telephone reminders and follow-up telephone interviews were conducted in each test region from Friday of. the first week through Monday of the third week by the field staff of a national commercial research company. The mailing dates, Including those for the follow-up procedures, were designed to compensate for the regional variations in postal delays. Four attempts were made to contact each respondent [or the telephone reminders and telephone interviews. In addition, the interviewer was allowed to speak to any responsible adult in the household if the head of household was not available. Finally, calls were made at various times of the day and evening that the local supervisor considered most appropriate. Every possible effort was made to minimize the differences in situational factors (time, person, and opportunity to reach) between the telephone and mail interviews.
The mail questionnaires were accompanied by cover letters on the letterhead of the local Bell Telephone Company. However, the content of the alert postcard, the cover letter, and the reminders was identical across all eight test market regions. All mailings were posted by the survey research manager of each local Bell Telephone Company and the return mail was delivered to that company.
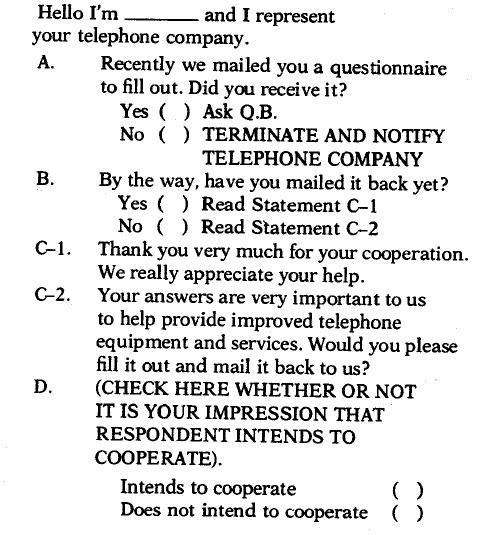
Post-experiment interviews were conducted with a subsample of respondents that included some customers who did not return the questionnaire by the end of the experiment. These interviews were held to determine the respondents’ feelings toward the survey in general and their reactions to the time intervals in the mailing and follow-up procedures, to verify the demographic information provided in the survey, and to check the understanding of specific questions. A total of 393 respondents were successfully interviewed; these were approximately equally divided among the three experimental factors. One-third of the interviews were conducted in person and the others by telephone.
An analysis of variance was performed on the data from the basic experiment, and the three experimental factors and all combinations of their interactions were tested for significance. In addition, specific questions on the test questionnaire were cross-tabulated by questionnaire length, follow-up method, and market. From the post-experiment survey, usage and attitude information were tabulated by return or nonreturn of the earlier experimental questionnaire, early vs. late ret urn, questionnaire length, and follow-up method. The post- experiment survey allowed the comparison of respondents and non-respondents in terms of both demographic and response characteristics.
Results and Discussion
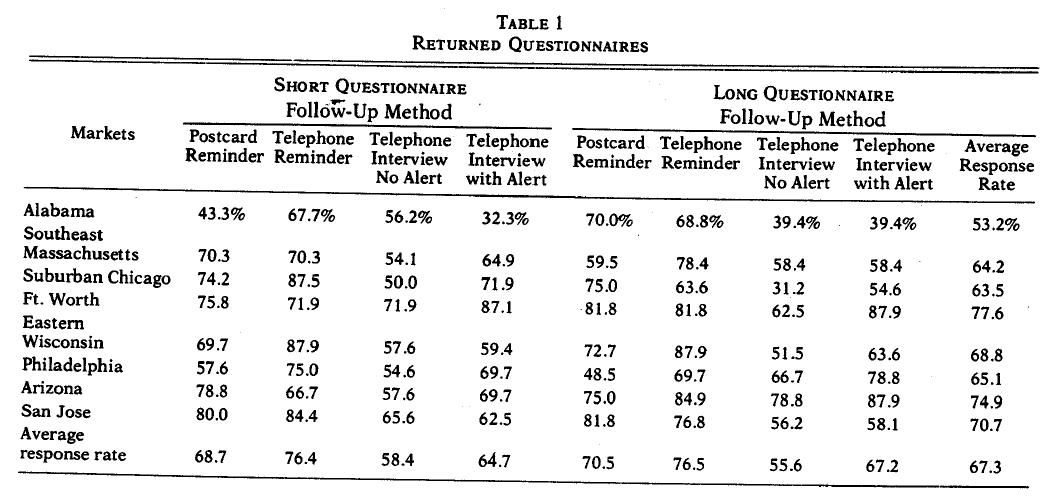
The results of the questionnaire returns are summarized in Table I. The overall response rate was 673%. There were significant differences across various experimental treatments of the three factors.
First, the four follow-up methods produced considerably different response rates across the markets and across the two versions of the questionnaire. The telephone reminder was the best follow-up, with an average response rate of 76.4%; followed by the postcard reminder, with an average of 69.6%; the telephone interview with an alert, with an average of 65.9%; and, finally, the telephone interview without an alert, with an average response rate of 57.0%. Based on the Newman-Keuls test on the pairwise differences within an experimental factor 7 AT&T found that most of the differences across follow-up methods could be attributed to two conditions: (1) the telephone interview without alert is significantly worse (p < .01) than the other three follow-up methods, and (2) the telephone reminder is significantly better (p < .05) than the other three follow-up procedures in generating response.
Second there were no significant differences in the response rate between the short and the long questionnaire. This result adds to the growing evidence that there is no adverse effect on the response rate with reasonable questionnaire length.
Third, as expected, the eight markets reacted differently to the experimental conditions. The best response rate came from the Fort Worth area, and the poorest response rate came from the Alabama area. The Newman-KeuJs test showed that most of the differences across the eight markets came from Alabama, which had a significantly lower response i-ate than all other markets (p < .05), and Fort Worth. which had a significantly higher response rate than the four below-average markets (p < .05).
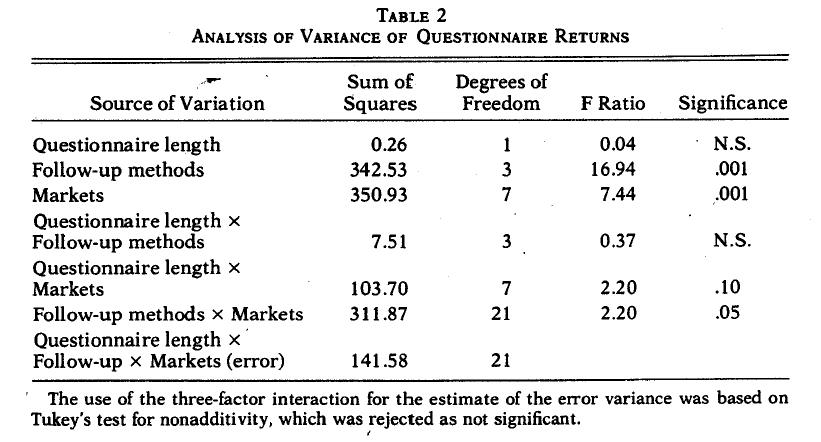
To quantify the significant differences across the three experimental factors and to isolate the main and the interaction effects, an analysis of variance using Turkey’s test for nonadditivity was performed on the data’ The results are summarized in Table 2. As expected, both the factors of follow-up methods and market heterogeneity had significant main effects, while questionnaire length had no significant main effect. Significant interaction effects were found between the follow-up method and market heterogeneity fact ore and, to a much lesser extent, between questionnaire length and market heterogeneity. No significant interaction effect was found between questionnaire length and follow-up methods.
A postexperiment survey was conducted to assess attitudinal differences among respondents belonging to different experimental conditions. One would expect no significant differences across experimental groups in their general attitudes toward survey participation when both the responders and nonresponders are included in each experimental group. This lack of difference would suggest that the experimental groups were in agreement in their feelings toward survey participation which can provide additional credence to the analysis of variance results.
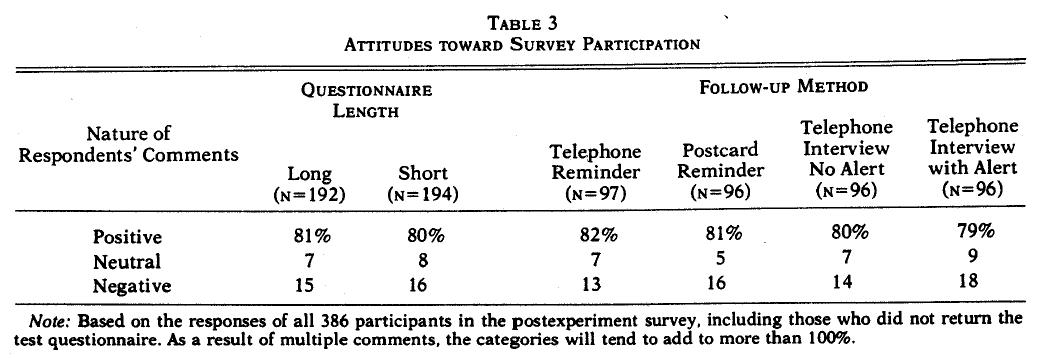
Table 3 summarizes the feelings of survey participants toward survey participation across different experimental conditions. These have not been broken down by market due to the extremely small sample sizes in each cell for many of the responses. As can be seen from Table 3 the percentages of positive, negative, and neutral comments are remarkably similar across the experimental conditions when both respondents and nonrespondents are grouped together. Overall, 81% of the respondents had positive feelings toward the survey, 15% had negative feelings, and 7% were either neutral or had no opinion. (As a result of multiple comments, the categories will tend to add to more than 100%.) This agreement among experimental groups with respect to their general feelings toward survey participation gives stronger support to the results discussed earlier.
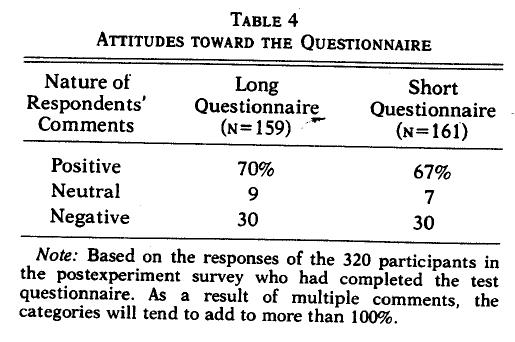
To obtain insights into the reactions to the specific experimental conditions (questionnaire length and follow-up procedures), the respondents were asked how they felt about the experimental condition to which they were subjected. Table 4 summarizes the feelings toward the length of the questionnaire lot- each of the two levels of the experimental condition. Only those who returned the questionnaire are included in this analysis. As can be seen from the table, there were no real differences between the short questionnaire and long questionnaire groups, although there was a slightly greater positive response to the longer questionnaire.
Interestingly, the group with the longer questionnaire considered it to be “comprehensive/well designed” to a significantly greater degree than the group with the shorter questionnaire (28% vs. 17%). However, this was somewhat offset by a higher percentage of positive responses in the shorter questionnaire group with respect to the “easy to fill out/not too long” (16% vs. 10%) and “questions were to help the company improve service” (11% vs. 6%) categories. With respect to the negative comments, it was surprising to find that considerably more respondents in the shorter questionnaire group felt that some of the quest ions were too personal (14% vs. 4%). As was expected, slightly more respondents in the longer questionnaire group felt that some ‘of the quest ions were complicated (12% vs. 8%).
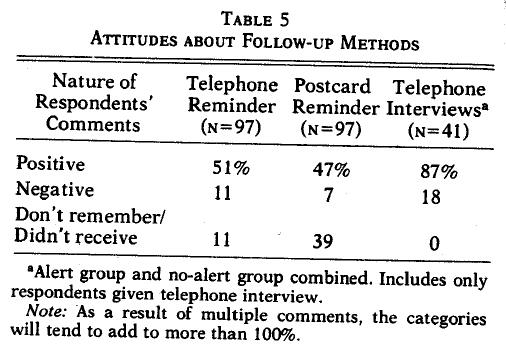
Table 5 summarizes the postexperiment comments specifically related to the follow-up methods. Due to the small sample size, respondents for both telephone interview follow-up procedures have been combined into a single category. Significantly more respondents in the telephone interview group gave positive comments than in the telephone reminder and postcard reminder procedures (87% vs. 51% and 47%, respectively). This is somewhat surprising in view of the fact that the response rate was lower for the telephone interview follow-up methods, However, most of the positive comments were more in the nature of doing a favor or ingratiating the telephone interviewer than of the advantage of the follow-up method. Thus, 41% stated that they did not mind the telephone interview and 30% said they were glad to help the company. In contrast, only 10% felt the phone call made the survey clearer and 27% favored the telephone interview over the mail questionnaire. Examining the positive comments in the telephone and postcard reminder groups, however, it was found that most of the positive comments were directly anchored to the use of follow-up procedures. Many respondents considered the follow-up a good idea or a good reminder.
With regard to the negative comments, it app ears that some of the cooperative respondents in the telephone interview group did not like telephone interviews or resented the telephone survey when they had an unlisted number (7%). Some of the respondents in the telephone reminder proced ure found it to be “annoying or pushing me” (15%).
Finally, a large percentage of respondents claimed they did not receive the postcard reminder or did not remember receiving it (39%). Similarly, some of the respondents in the telephone reminder group also claimed they did not receive, or did not remember receiving, the reminder (11%). Inasmuch as it is easier for the respondent to claim nonreceipt of a mail reminder than a telephone reminder, the superiority of the telephone reminder found in the study may be due partly to this factor.
Postexperiment analysis of the eight markets produced no significant differences except that the respondents in the Fort Worth area had significantly higher Incomes than the 1970 Us. Census data for the area had indicated. Due to the many multiple telephone numbers in the upper- income households in the Fort Worth area, the random probability sample had generated a greater number of upper-income respondents.
The lack of systematic differences in the feelings toward survey participation, or toward specific experimental conditions across,4he eight markets, is disappointing as the authors believe that the concept of market segmentation in survey research is meaningful. That Is, some questioning procedures are better suited for one segment of the total respondents while others are better suited for other segments, and no single technique of data collection would optimize the returns from all segments of the population.
Summary and Conclusions
This study was designed to test and evaluate two specific questions for management. First could an instrument of 26 attitude items be added to the present questionnaire without hurting the response rate? Second, was there a practical alternative to the present follow-up procedure that would increase overall response rate? The results clearly indicated that the attitude questions could be added to the questionnaire without any measurable effect on response rate and that the longer questionnaire would not influence the selection of the follow-up procedure. The telephone reminder with the second mail questionnaire proved to be the best overall strategy to replace the present postcard reminder. The telephone reminder was consistently more effective over all markets and made a more positive and memorable impression on the survey participants. The emphasis here was placed on increased response rate, which would result in imp roved panel validity and effectiveness; therefore, no direct cost comparisons were made. However since the survey mailing and collection are done locally, the telephone reminder costs compare favorably with the costs to print, address, and mail the reminder postcards. It is interesting to note that both the low-cost reminders and mail return performed better than the more expensive telephone interviewing. It is encouraging to know that better results do not have to cost more.
Since the telephone reminder and the postcard reminder are similar in nature and differ only in form, it is possible to suggest that if specific markets find that the results with the telephone reminder do not achieve a better return than their previous experience, they should continue to use the postcard reminder. This tailoring of the survey procedure to specific markets suggests that the best survey methodology might be different for various market areas. In particular, the results of this study suggest that high-income socioeconomic customer groups and those in the Southwest respond best to the alert and telephone interview. However, this procedure should not be used in many areas of the South, where the best response was obtained by a telephone reminder. The telephone interview is also not recommended as a follow-up procedure In and around the major metropolitan areas, inasmuch as the telephone reminder was preferred in the city and the postcard reminder was more effective in the suburban areas. However, additional research is needed to confirm and extend these secondary findings.
Notes